Benchmark Results
Comprehensive evaluation of 40 MLLMs across 19 degradation types, 30 fine-grained clinical skills, and 7 imaging modalities.
Overall Performance (Fig. 3)
Most evaluated MLLMs exhibit severe robustness deficiency with nonlinear degradation patterns. Even the best-performing model shows substantial accuracy drops at L2 severity.
Model performance across medical image quality degradation. Accuracy of 40 MLLMs evaluated at three severity degrees (L0–L2). X-axis labels are colored by model category: blue for open-source general models, brown for commercial MLLMs, and purple for medical-specialized models.
AI Dunning-Kruger Effect (Fig. 4)
Key FindingAll models exhibit severe overconfidence under degradation. As degradation scales from L0 to L2, the stability of perceived performance against collapsing accuracy reveals a fundamental failure in metacognitive awareness.
Comprehensive analysis of model calibration shift across severity degrees. These panels quantify the widening gap between actual accuracy and model certainty under increasing image degradation. As degradation scales from L0 to L2, the stability of perceived performance against collapsing accuracy reveals a fundamental failure in metacognitive awareness across MLLMs.
Intra-Model DKE
As severity increases from L0 to L2, actual performance drops but calibration shift remains stable or increases - the model is "unaware" of its own declining capability.
Inter-Model DKE
At severe degradation degrees, lower-performing models overall exhibit disproportionately higher calibration shift compared to higher-capability models.
Degradation-Type Sensitivity Heatmap
MLLMs are strikingly vulnerable to physics-based artifacts and motion interference compared to intensity-based degradations. Artifacts cause the largest performance drops.
Comprehensive degradation heatmaps showing performance drops from baseline (L0) to gradual degradations (L1 and L2) across different models and degradation types.
Capability-Level Performance (Table 2)
Average accuracy across the mid-level capability dimensions, computed over L1 and L2 degradations. Numbers in parentheses show performance drop from L0.
CU: Clinical Understanding. IP: Imaging Perception. AR: Anatomical Recognition. BS: Basic Science. Diag.: Diagnosis. Treat.: Treatment.
Degradation-Category Performance (Table 3)
Average accuracy across five degradation categories. Physics-based artifacts and motion interference cause the largest performance drops.
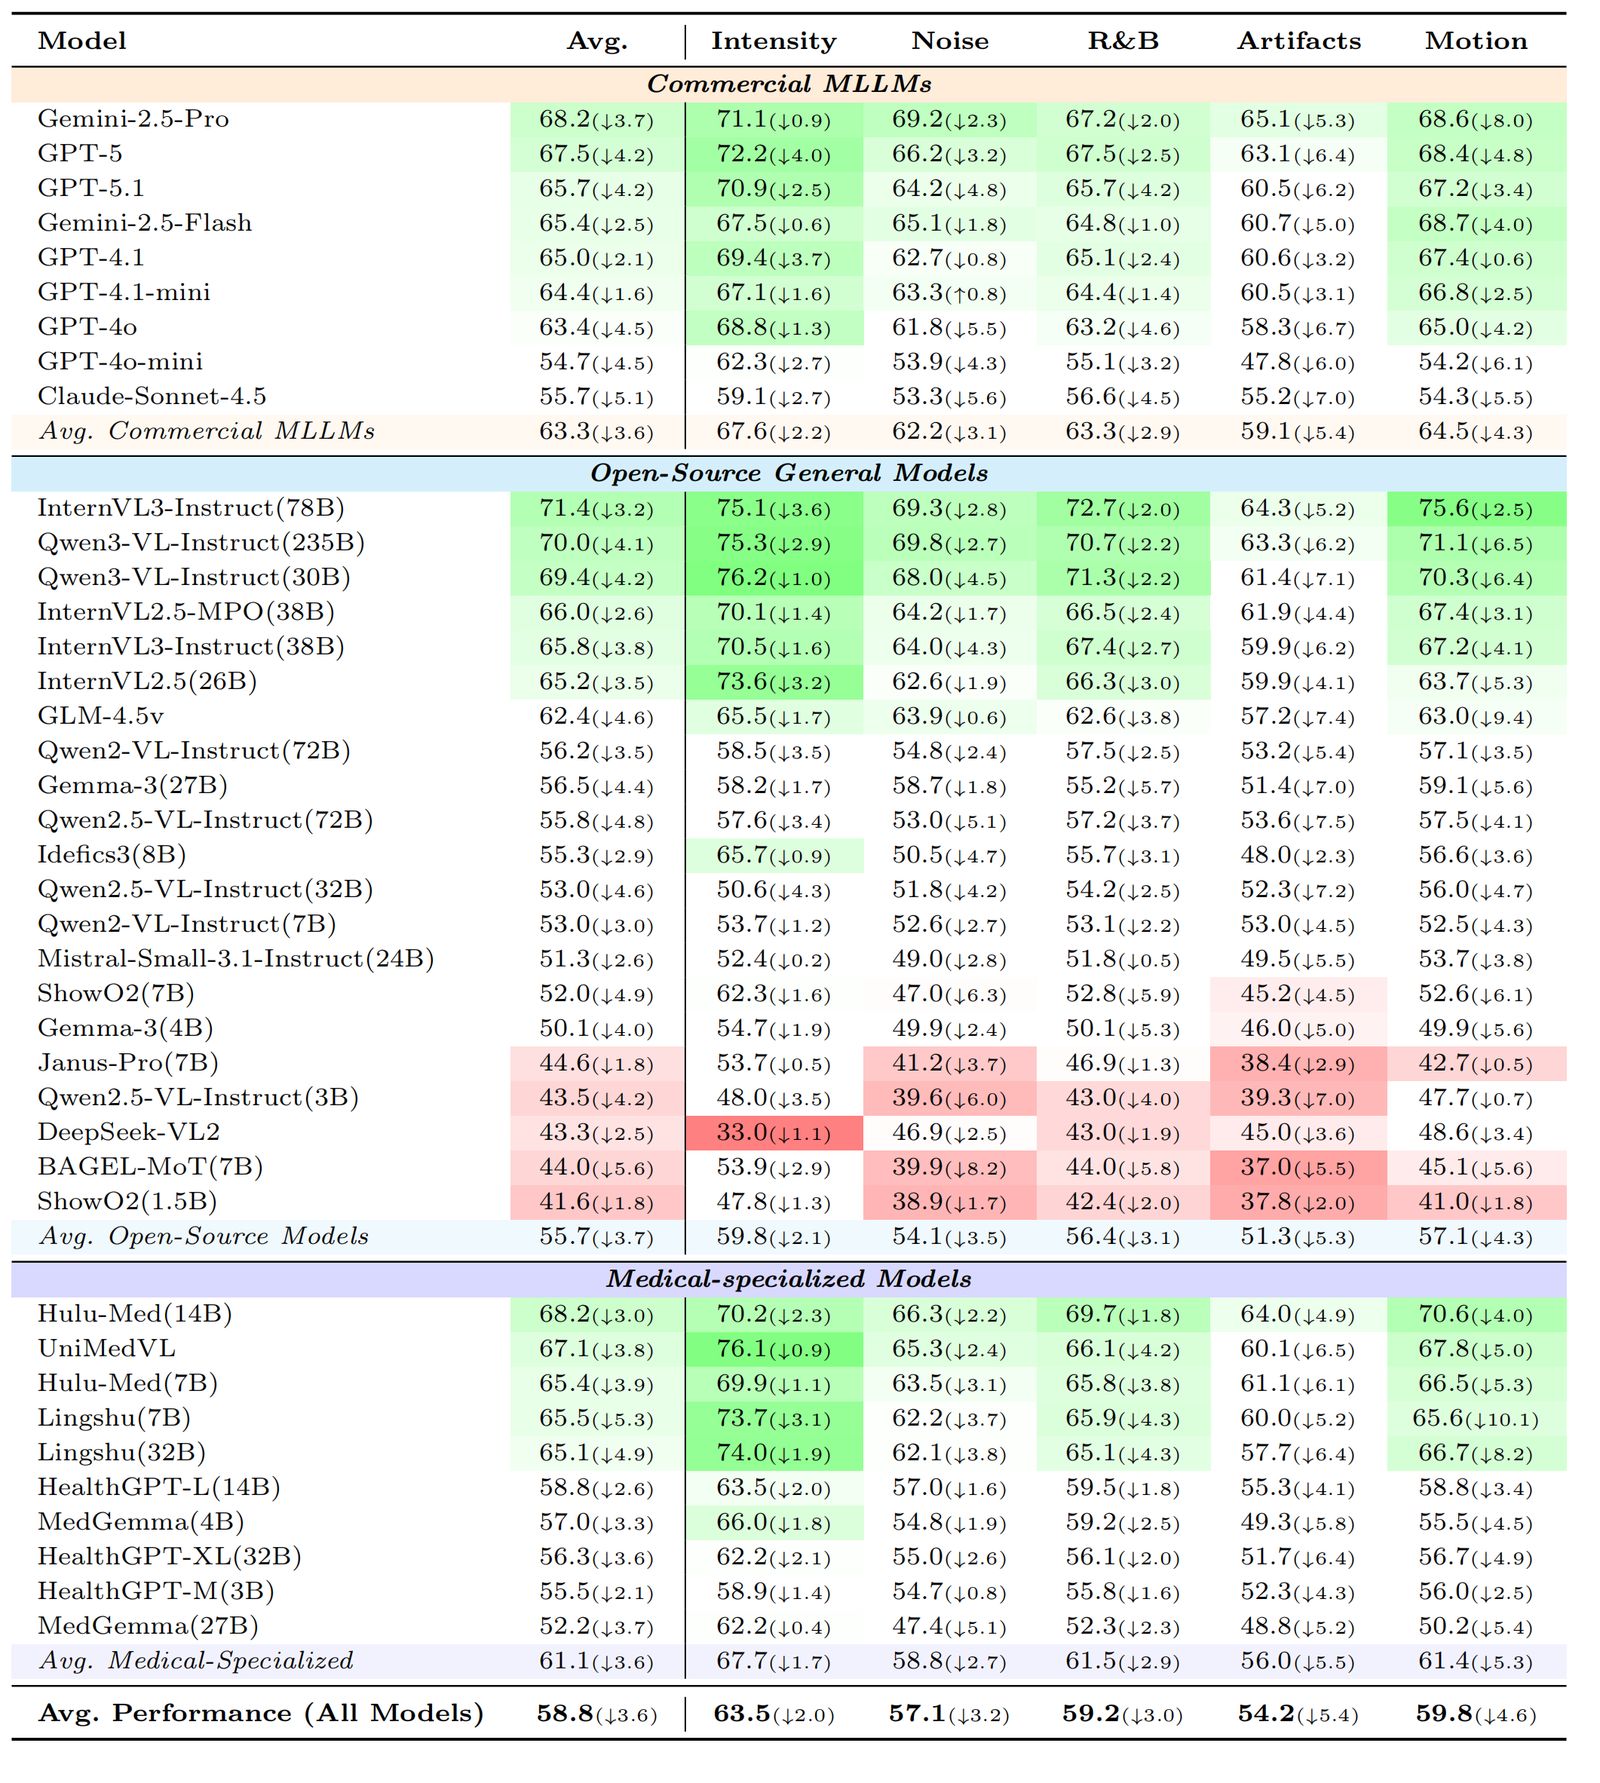
R&B: Resolution and Blur. Numbers computed over L1 & L2 degradations.
Simulated vs. Real-World Validation (Fig. 5)
t-SNE projection confirms simulated and real degraded images co-locate within each modality cluster. Model rankings on simulated data faithfully predict rankings on real clinical images.
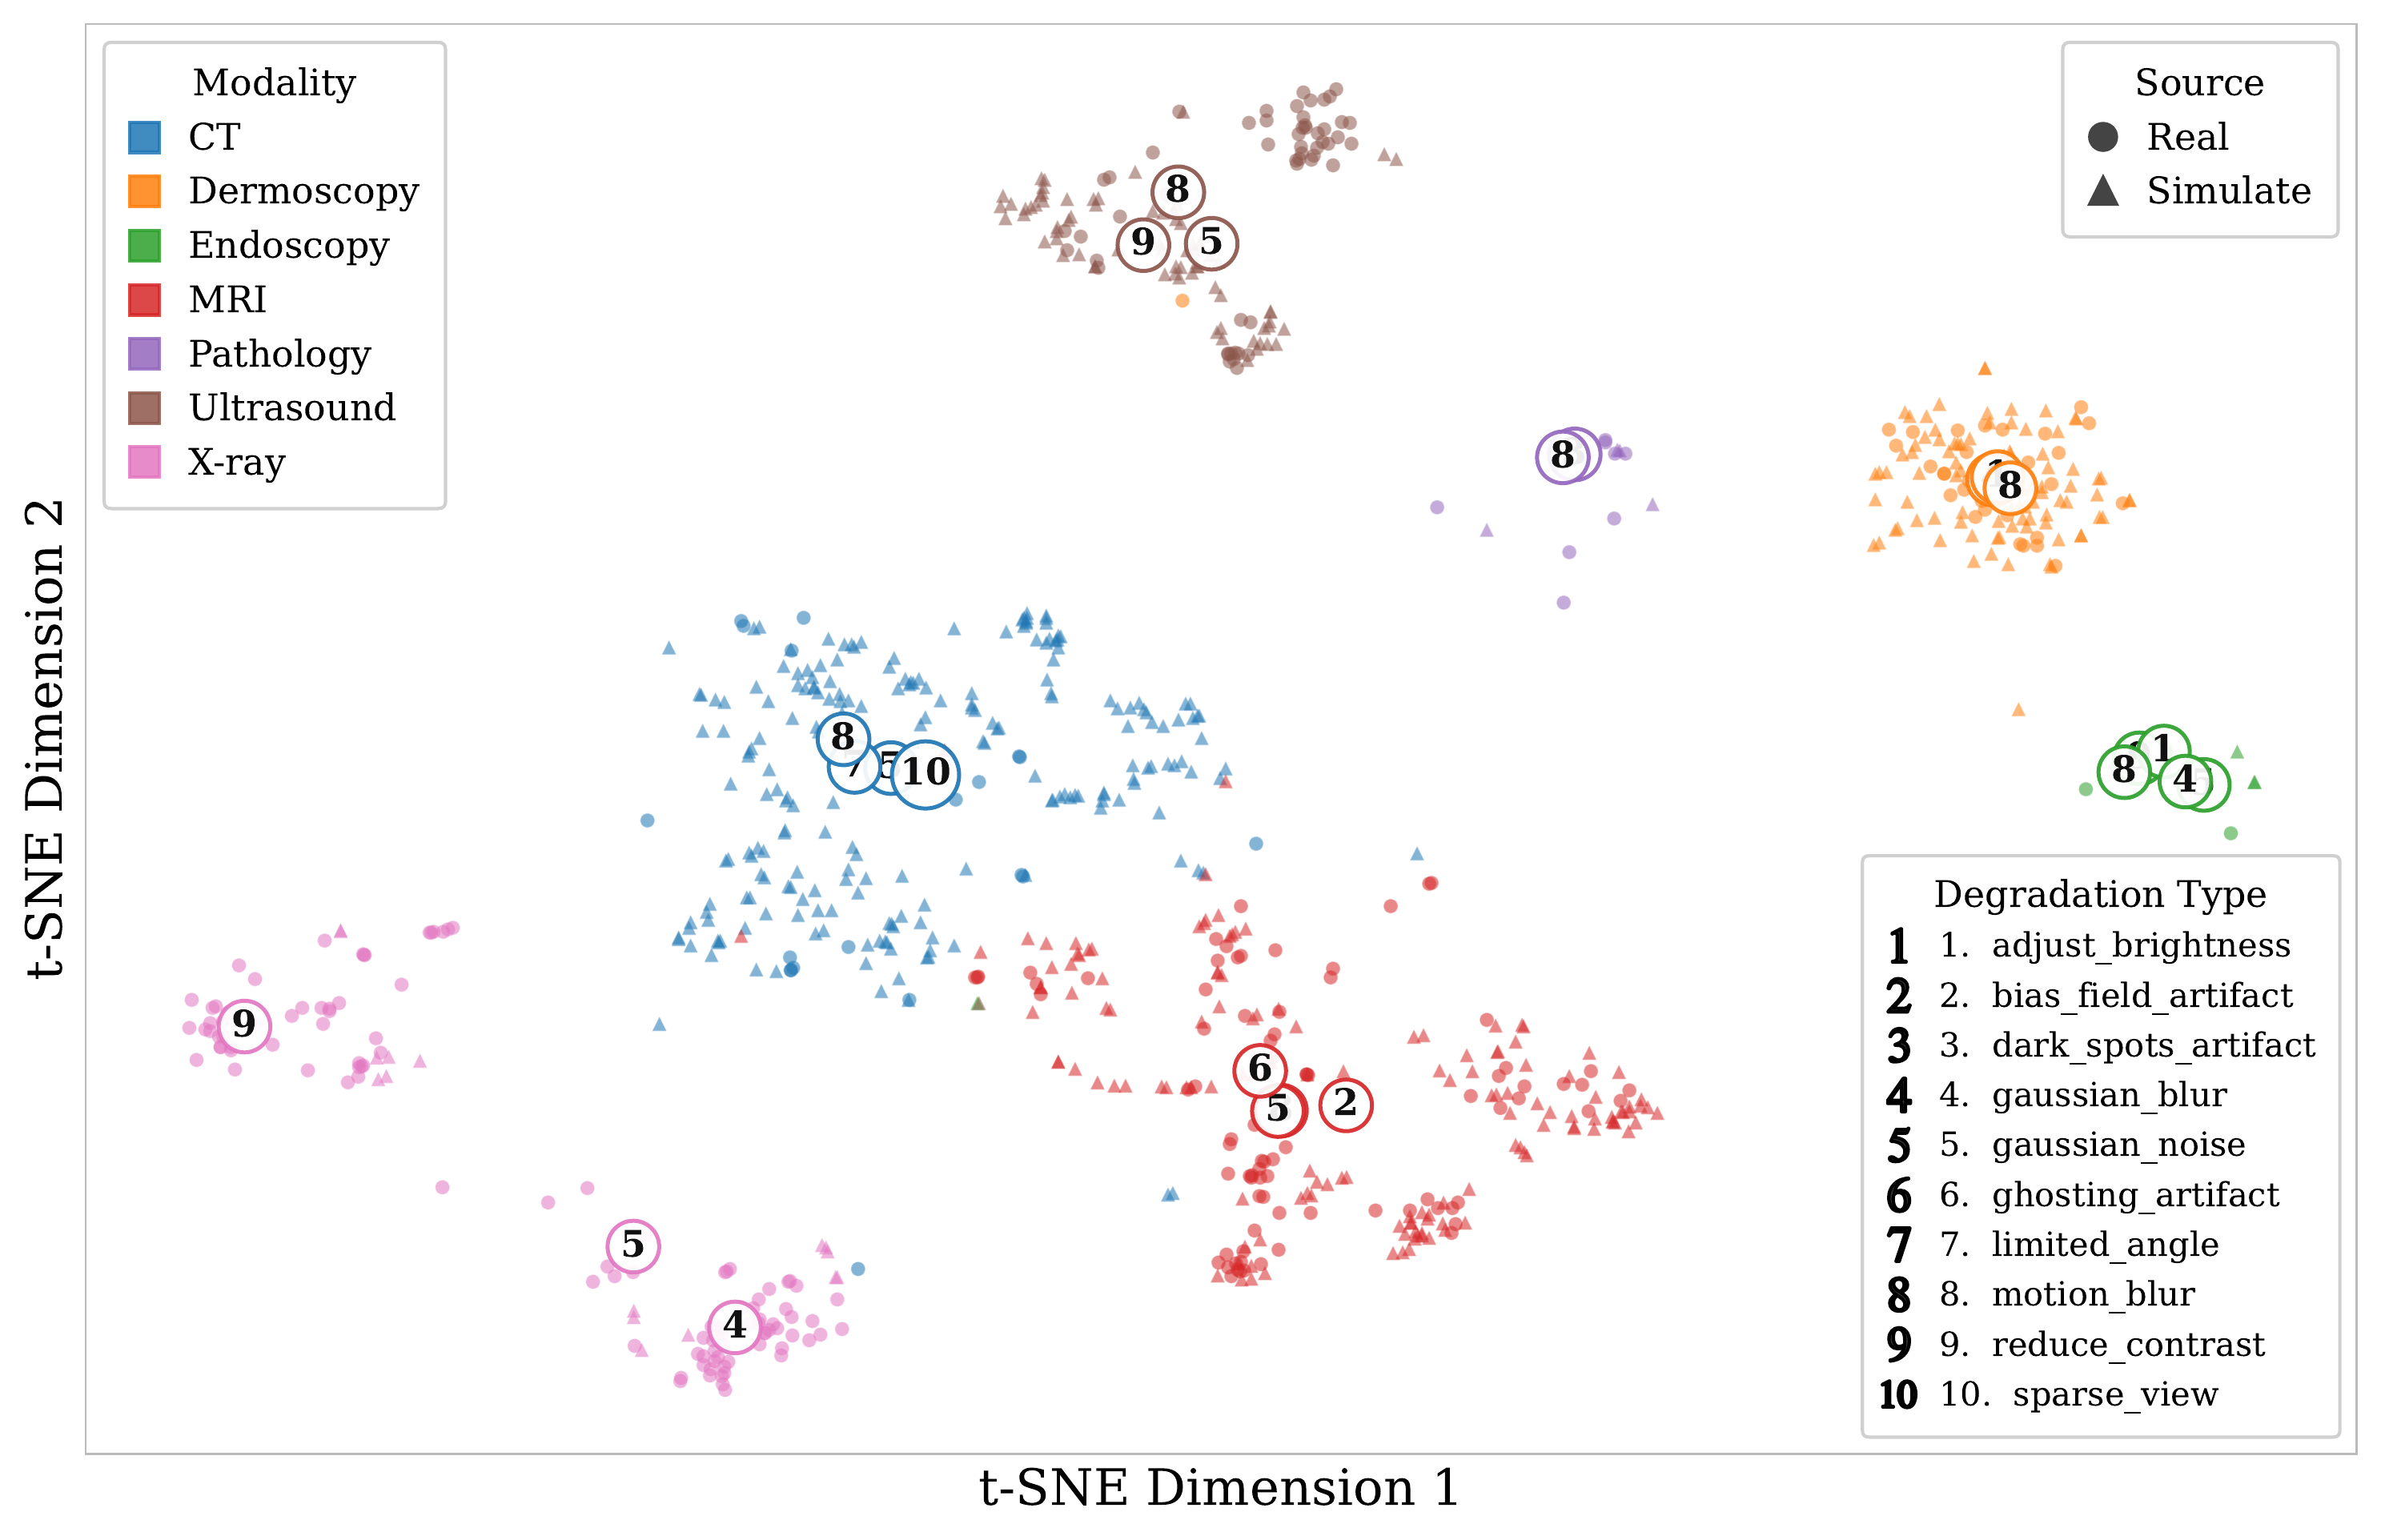
(a) t-SNE projection of BiomedCLIP features from simulated and real degraded images, colored by degradation type.
(b) Per-model rank trajectories remain highly consistent across simulated and real-world conditions.
Explore the Full Dataset
Access the complete evaluation results, including per-model breakdowns and detailed analysis.